

For the second year in a row, drought conditions are impacting transportation on the Mississippi River at the peak shipment point of the year. Shallower river levels mean barge weight restrictions, slower barge traffic, and higher costs to ship commodities on the river. Ultimately, this translates to a relatively lower price at the farmgate and higher cost for the world buyer.
Drought Slows Grain Barge Traffic in 2022 and 2023
The Mississippi River is an important channel for commodity transportation. The USDA reports the final mode of transport was barge for 13% of U.S. grains in 2020, and 46% of exported U.S. grains[i]. There are normally two peaks in grain barge movements, one in late summer leading up to the end of the marketing year for corn and soybeans, and the other emerging in the fall harvest season and into the post-harvest months.
The impact of low water levels on grain barge movements was notable in 2023, marking the second consecutive year of drought impacting Mississippi River transportation.
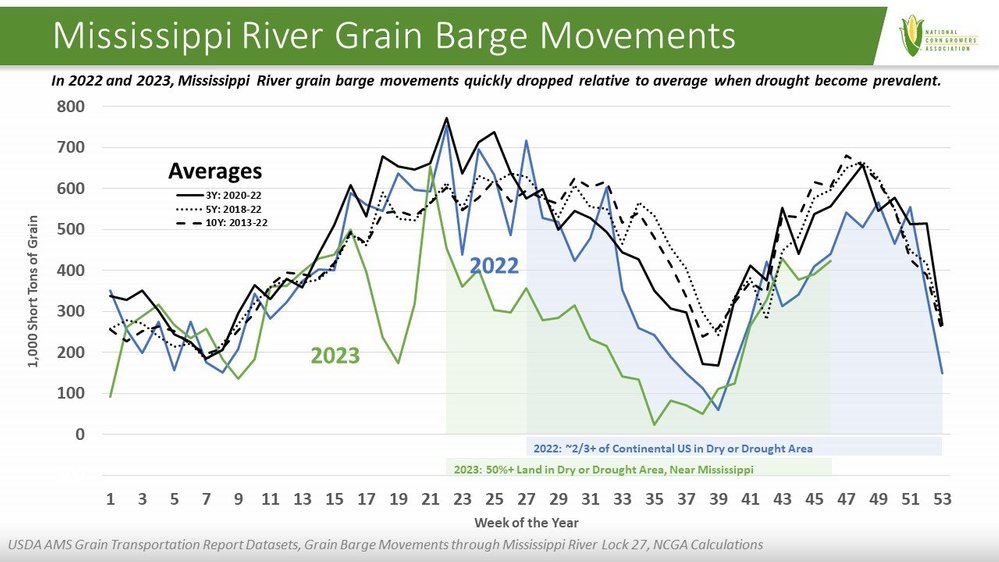
By July 2022 over two-thirds of the continental U.S. was in abnormally dry or drought conditions, expanding to over 80% in October and November. Barge grain movements quickly dropped off in July and mostly stayed well below the average weekly pace through the year-end as noted by the blue shaded area in the figure above relative to the black average lines.
In 2023, drought conditions were less expansive across the entire U.S. covering about 50% to 60% of land area from June through the present time, but drought was more concentrated in the Mississippi River watershed area. Although largely a drought year, flooding from systems of heavy rains in late April slowed river traffic for a few weeks. Aside from that blip, weekly grain barge movements followed an average pace from the beginning of the year through May and then as drought area around the Mississippi River intensified, grain barge movements dropped as noted by the green shaded area in the figure above relative to the black average lines.
Corn Grain Transport Rates & Costs
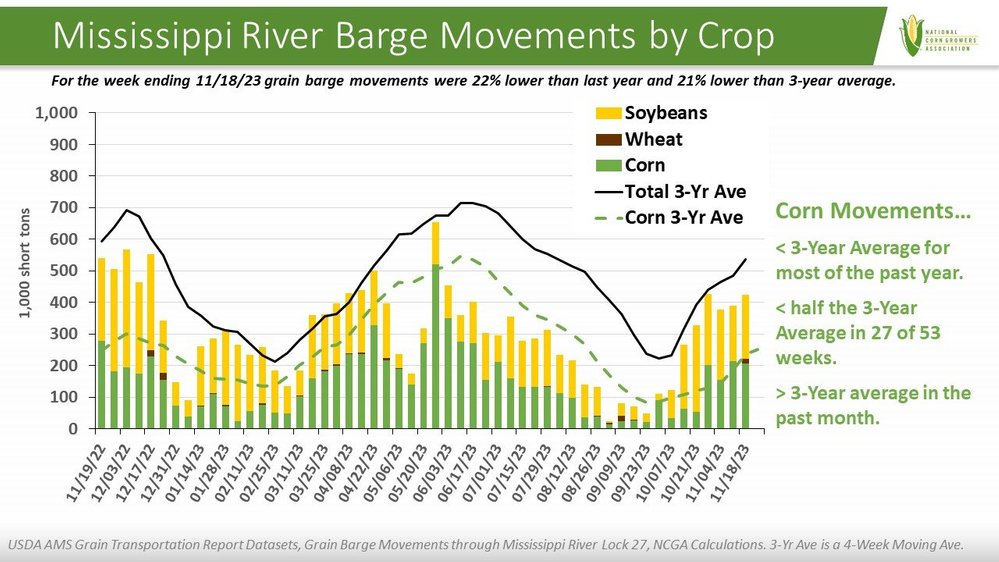
As with movement of all grain, corn shipments trailed the 3-year average[ii] level for most of the past year based on movement through Lock 27 on the Mississippi River, and not by a small amount. Corn barge movements were less than half the 3-year average movement in 27 of the past 53 weeks, as illustrated by the green portion of the bar relative to the green 3-year average line in the figure below. Weekly movements of all grains with breakouts for soybeans and wheat can also be viewed relative to the total 3-year average black line.
Not only do shallower river levels mean barge weight restrictions and slower barge traffic, but also a higher cost to ship commodities due to lower capacity on the river. That cost is a factor in the price of the commodity at port, elevating price for prospective foreign buyers.
Southbound barge spot rates vary depending on where the barge begins the southbound journey, with rates typically higher at locations closer to the river source. USDA provides spot rates based on seven benchmark groups based on location. Spot rates generally peak in late October or early November of each year.
The fall 2020 and 2021 spot rates are representative of the average fall levels of the prior decade. The fall 2022 peak was extreme, exceeding double the peak spot rates of fall 2020 for every benchmark. Although spot rates were higher than what would be considered normal in fall 2023, rates didn’t rise to the extreme levels of last year. But barge spot prices were still elevated compared to the norm, especially in locations closer to the mouth of the river. For example, the peak rate for the Cairo-Memphis benchmark was $53.03 in fall 2023, 69% higher than the $31.40 peak in fall 2021 and 148% above the $21.35 peak in fall 2020.
Impact on Competitiveness of U.S. Corn
The situation impacts the competitiveness of U.S. corn in the world market and reduces initial demand at the farm level.
As barge weight capacity is reduced and barge tariff slows, basis offerings are impacted translating to a lower price at the farm level that varies by location. Lower farm prices reduce incentive for farmers to make sales. Various estimates indicate farmers have sold less corn this year than the average pace.
Total transportation costs are a component of corn price at port. When river transport costs are elevated it puts upward pressure on the price of U.S. corn in the world market, especially when paired with a strong dollar value.
The U.S. Gulf Port price for corn was higher than the Brazil port price 16% of the time in 2021. In the time since drought impacts on grain barge movements began in July 2022, the US Gulf price has been higher than the Brazil port price 83% of the time. In this time the dollar value has also been strong and there are other contributing factors, including a drought-reduced 2022/23 U.S. corn crop while Brazil had record production.
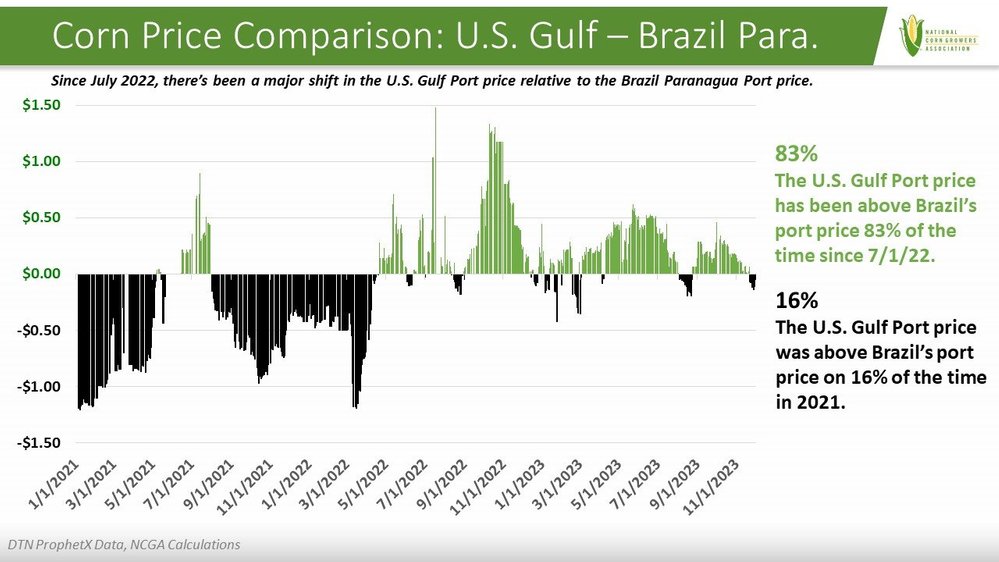
Throughout November the margin between the two prices narrowed. Currently, the prices are nearly equal. In that time, grain barge movements have more closely aligned with the average pace, and barge spot rates have retreated to normal range for the time of year. Also contributing is the weaker dollar value and the U.S. flush with corn supply while Brazil is between harvest seasons.
Although the U.S. faced Mississippi River issues the past two years, transport reductions and cost impacts in other major grain transit waterways such as the Panama Canal and Amazon River have emerged in recent months and will be important to monitor along with the Mississippi River.
For now, the shift to the current equitable port price relative to Brazil removes the price barrier for export demand that has existed for most of the past 1.5 years, a positive point in the demand outlook for U.S. corn farmers.
[i] https://agtransport.usda.gov/stories/s/Transportation-of-U-S-Grains-A-Modal-Share-Analysi/n6aq-hd3y/
[ii] Note that the 3-year average is of the 4-week moving average.